

EEG Insights
Unraveling how the brain visualizes seen and imagined images through EEG


Decoding the Mind's Eye
By bridging the gap between subjective mental imagery and computational synthesis, our Brain-Computer Interface decodes complex EEG signals to reconstruct the vivid images formed purely within human imagination.
How BCI Reconstructs Imagination
Using high-density EEG arrays, we capture the subtle neural oscillations triggered during active visualization. Machine learning models then map these electrical patterns to latent feature spaces, generating high-fidelity visual outputs.
Poster Overview
Reconstructed Gallery
References
Examine the experimental design, comparative analysis, and statistical frameworks.
Browse the visual comparisons between perception and real-time mental imagery.
Review the peer-reviewed literature, datasets, and methodology supporting this study.
Overview
EEG-based study comparing visual perception and imagery.

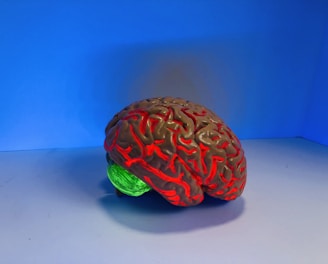
Biostatistics Role
The biostatistics team validates findings by analyzing EEG stationarity, covariance, spectral power, and connectivity, using rigorous permutation testing and corrections to ensure robust, interpretable results guiding feature selection.

AI Pipeline
Our AI system uses graph neural networks and temporal transformers to decode EEG signals, aligning neural, image, and text data into a shared space for image reconstruction from imagined content.
Gallery


Visualizing neural patterns and AI reconstruction steps
Research References
A comprehensive list of foundational datasets, peer-reviewed literature, and methodology frameworks supporting our neural pattern visualization and EEG imagery analysis.
[5] Maris & Oostenveld (2007)
[6] Vaswani et al. (2017)
[7] Rombach et al. (2022)
[1] Gao et al. (2026), VI-EEG dataset: https://doi.org/10.1038/s41597-025-06512-5
[2] Guttmann-Flury et al. (2025): https://doi.org/10.1038/s41597-025-04861-9
[3] Xie et al. (2020), posterior alpha: https://doi.org/10.1016/j.cub.2020.04.074
[4] Ombao & Pinto (2024): https://doi.org/10.1016/j.ecosta.2022.10.005